


Audit-ready data is not the report you write after the run. It is the raw, timestamped record that environmental test chambers wrote while the run was happening, kept in a form a stranger can follow back to one channel and one clock. We have sat in audit rooms where a laboratory had every chart it needed and still collected findings, because the numbers behind those charts could not be traced to a named sensor, a documented location and a defensible moment in time. The chamber is where the primary record is created, and everything an auditor reads later is a copy of what happened inside it.
This guide follows the order a data trail is actually built, not the order a report is assembled. We will cover five things in sequence: what the word data really means in an audit, which channels you must record and how often, how to make a timestamp trustworthy, how to turn an interruption into a record instead of a blank, and what GJB, IEC and GB/T each expect you to archive. The machine choice comes last, because the evidence decides the equipment and never the other way round.
The short version, if you only read this far
- Data means the raw sample stream, not the report built from it.
- The logging interval has to be short enough to see the smallest fluctuation your specification claims.
- A timestamp is only as good as the clock behind it, and an unverified clock poisons every other number.
- An interruption that is written down is evidence; an interruption that is silent is a hole.
Step 1: Understand What an Auditor Means by Data
In an audit the word data means the raw sample stream, not the document built from it, and the two have different properties that matter. The raw stream is written by the controller while the profile runs. The report is assembled afterwards by a person, from selected figures. Only one of those two can survive a follow-up question, and it is not the one with the nice formatting.
| Property | Raw record | Report written afterwards |
|---|---|---|
| Who writes it | The controller, during the run | A person, after the run |
| What it contains | Every sample, with channel, location and timestamp | Chosen points, curves and conclusions |
| What it can prove | That the condition actually occurred | What someone believed occurred |
| Weakness | Hard to read without context | Cannot answer a question it was not written for |
Most laboratories keep the left column only for the first hour and lose it somewhere between the machine and the report template. The values get screenshotted, retyped and rounded, and by the time the file reaches a customer it is a paraphrase of the physics rather than the physics itself. Once you accept that the raw stream is the evidence and the report is a summary, the next question is which values that stream has to contain, and how tightly they need to be spaced.
Step 2: Record Every Channel, and Log Tightly Enough to Resolve It
The interval you log at must be short enough to show the smallest fluctuation your own specification claims, or the record cannot demonstrate that the chamber was in control. This sounds obvious until you put real numbers against it, and that is where the published figures become genuinely useful.
Our high and low temperature climate platforms are specified at a temperature fluctuation of ±0.3 °C and a humidity fluctuation of ±2.0% RH. Uniformity across the workspace is 1.5 °C or better for temperature and better than 3.0% RH for humidity. Those are the numbers we commission against, and they are also the numbers that dictate how the log has to be written.
| Channel to record | Figure we publish | Interval that can resolve it |
|---|---|---|
| Temperature at the control point | ±0.3 °C | Seconds, never minutes, so an excursion is not averaged away |
| Humidity at the control point | ±2.0% RH | Matched to the temperature interval, so sensor lag is not read as drift |
| Temperature across the workspace | 1.5 °C or better | A tight window at each corner, taken with the load in place |
| Humidity across the workspace | Better than 3.0% RH | Same window on both channels, so the dew point logic stays honest |
Think about what ±0.3 °C really means for a logger. An excursion that lasts ninety seconds is a real event inside a band that narrow. If the file writes one point every five minutes, that event never appears, and an auditor cannot tell a stable chamber from a chamber with an unlogged disturbance. A workable rule is at least ten points inside the shortest event you care about, which in practice pushes transitions and stabilisation windows into a few-second interval and lets the long soak run coarser.
Interval should follow the phase, not the habit. Log the dwell coarsely enough that the file stays reviewable, log the transition tightly enough to show the rate and any overshoot, and log both humidity and temperature on the same tick so a response-time offset cannot be mistaken for a trend. Our standard volumes run across 80 L, 150 L, 225 L, 408 L and 1000 L, and the bigger the volume and the denser the load, the more the air path matters. That is why the same platform uses a top air supply and bottom return layout, with an anti-condensation design in the roof so condensate does not drip onto the samples and distort the very values you are recording.
Once the channels and their spacing are settled, the values themselves are only half the record. The next thing an auditor will test is the clock those values are stamped with.
Step 3: Make the Timestamp Defensible
A timestamp is worth exactly as much as the clock behind it, and an unverified clock quietly undermines every temperature and humidity value in the file. Four things fix that, and none of them takes more than a few minutes a month.
- Compare the controller clock to one reference. At every calibration, compare the chamber clock against the laboratory reference and write the difference down as a number, even when it is zero.
- State the time zone and the offset. An unlabelled local time becomes ambiguous the moment a file crosses a site or a server, and ambiguity reads as a discrepancy.
- Watch the drift, not just the reading. A clock that has moved steadily in one direction over three checks is a finding you can resolve on your own terms, before someone else raises it.
- Keep the edition of the standard in the record. Writing GB/T 2423.2-2008 or the equivalent IEC 60068-2 part tells the reader which method applied, because a later edition can change a tolerance or a stabilisation rule.
We have seen an internal audit blow up over nothing more than this. Two exports from the same run disagreed by roughly four minutes because the controller clock had drifted away from the lab server, and while no physicist disputed the result, the investigation ran for two weeks and the lot had to be repeated to close the finding. A one-line synchronisation record would have ended it in a sentence.
A clock you can trust tells you when something happened. The harder question, and the one that produces the most findings, is what you write down when something goes wrong in the middle of a run.
Step 4: Turn an Interruption Into a Record, Not a Blank
Every interruption should sit in the file as an explained event, because an unexplained gap is the only thing in a data package an auditor can actually prove. An anomaly that is recorded, evaluated and dispositioned is normal testing under real conditions. The same anomaly left silent is a hole.
- A door opened part way through a dwell to reposition a fixture.
- A refrigeration or compressor trip, and the recovery time that followed.
- A power interruption, what the controller registered, and where the profile picked up again.
- A sensor or probe replaced mid-programme, with the calibration reference for the replacement.
- A profile restarted after an operator stop, with the time of the stop and the point of restart.
What matters is not that the power stayed on, it is how the controller behaved when it did not. There are three common recovery behaviours, and you should know which one your machine uses before you need to explain it: resume automatically from the point of interruption, hold and wait for an operator decision, or abort and require a clean restart. Whichever it is, the behaviour belongs in the quality record, along with a written decision on the affected segment, either re-run or formally accepted. A chamber that resumes silently after a power loss leaves a gap nobody saw, and no later explanation can fill it.
This is also where a methods document such as GB/T 2423.1 or its IEC 60068-2 counterpart becomes practical rather than theoretical. Those methods describe a stabilisation requirement, which means the dwell clock only starts once the specimen has genuinely reached the condition. A recording gap inside that window does not just lose a data point, it puts the start of the dwell in doubt, and that is a question you cannot answer after the fact.
Raw values, sound timestamps and honest event records together form the package. The last question is how long that package has to remain available, and what each framework wants inside it.
Step 5: Archive What GJB, IEC and GB/T Each Expect You to Keep
The three families describe almost the same physical conditions but ask for different paperwork, and the heaviest requirement is the one to build your archive around. Take the strictest list and the lighter frameworks are covered automatically.
| Family | Documents you will meet | What it expects in the archive |
|---|---|---|
| IEC | IEC 60068-2 | Condition, tolerance band and stabilisation defined inside the method itself |
| GB/T | GB/T 2423.1, GB/T 2423.2, GB/T 2423.34 | Calibration chain, equipment logs and a record of how deviations were handled |
| GJB | GJB 150.3, GJB 150.4, GJB 150.9 | Configuration tied to a build, traceable calibration, written disposition of every anomaly |
| MIL-STD | MIL-STD-202G-103B | A documented rationale for every tailoring decision |
The difference between the rows is procedural rather than thermal. GJB-driven programmes tend to ask for configuration records tied to a specific build, calibration traceable to a national metrology institute, and a written evaluation of each deviation with a stated disposition, which is a heavier burden than the commercial documents carry. We support those programmes through our defense equipment solutions, and the conversation always starts with the evidence list rather than with the chamber model.
On retention, keep the raw file beside the report rather than in place of it. Store it in an open format so it will still be readable when the software that produced it has been retired, make it read only so nothing can be edited quietly, and record its identity with a size, a creation time and a checksum. A period you never enforce is not a retention policy, so set the archive to run automatically instead of trusting someone to remember.
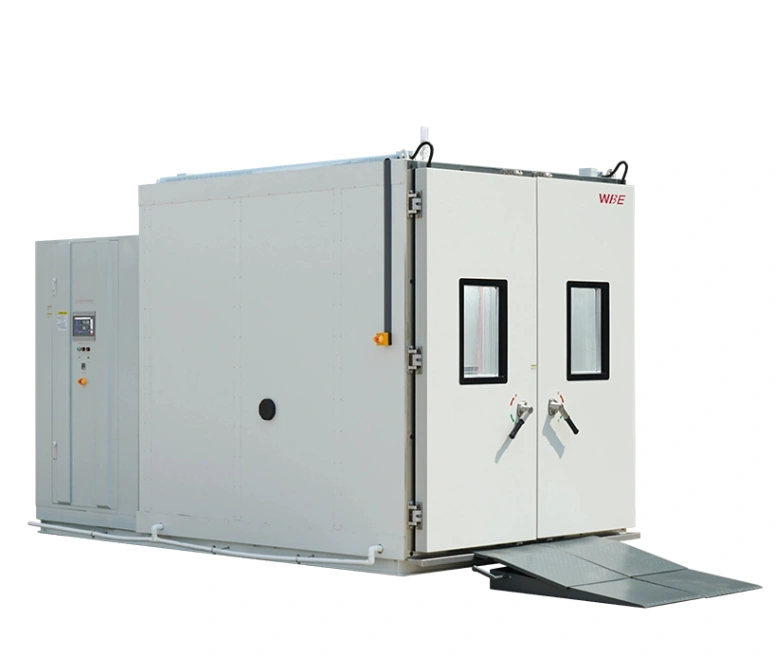
Once the evidence list is clear, the platform tends to choose itself. Labs anchored on steady-state damp heat usually run a constant temperature and humidity test chamber, while teams that also answer to internal reliability specifications often standardise on the WBE-SGD408L high and low temperature climate chamber so one unit covers dry heat, cold and humid heat. The full environmental test chamber range lists working volume, temperature class and airflow direction model by model, which is the honest way to compare logging behaviour rather than headline numbers.
Semiconductor teams add a narrower demand, because their documents want per-cycle integrity and the load board has to stay inside the band on every cycle rather than on average. That is why load position becomes a written parameter and why our semiconductor application page describes how those runs are laid out. Where a programme insists on requalification after any repair, our guide to maintenance and calibration for environmental test chambers is worth reading before the repair happens, not after, because the calibration chain is the part of the evidence that is hardest to rebuild.
Frequently Asked Questions
What counts as raw data on environmental test chambers?
The sample stream the controller wrote during the run, with a value, a channel, a location and a timestamp for each point. A trend curve exported as a PDF is a picture of that stream, not the stream itself. When an auditor asks for the source behind a figure, a screenshot is not an answer, and a rescanned printout is worse.
How often should temperature and humidity be logged?
Tightly enough to resolve the fluctuation you claim. If the specification says ±0.3 °C, a five-minute interval cannot show a ninety-second excursion, so transitions and stabilisation windows need a few-second interval while a long soak can run coarser. Always log both channels on the same tick, because temperature and humidity sensors have different response times.
Can we rebuild an audit-ready record from a chart afterwards?
No. A rendered curve cannot be converted back into the samples it was drawn from, so you can describe what the run appeared to do but cannot produce the channel-level, timestamped values a reviewer may ask for. Capture the record correctly during the run, because there is no recovery path afterwards.
What is the most common data finding you see?
Two, and they travel together. A uniformity survey taken with an empty workspace is later applied to a loaded run, and the transition data is missing because nobody checked the logging interval before the programme started. Neither is dishonest; both are assumptions nobody examined until an auditor asked.
Environmental test chambers rarely fail an audit because the cooling circuit was weak. They fail because the record of what the cooling circuit did was too thin to answer the third follow-up question. Decide the sampling plan, the channel map, the clock discipline and the event log before the programme starts, and the report stops being a summary of what you remember and becomes a description of what actually happened. Bring us the test plan and the editions you answer to, and we will read the data trail the way an auditor would.
Your record is only as strong as the chamber that wrote it
See how our climate and humidity platforms handle multi channel logging, sensor port placement and raw export, described model by model instead of summarised into one headline figure.
Review the logging ready platforms Send us your data trail